A model with 99% accuracy can still be useless. If you are detecting fraud that shows up in 1% of transactions, a model that flags nothing scores 99% and catches zero criminals. That gap between a good-looking number and a model that actually works is why evaluation metrics matter. Picking the right metric is half the job of building a machine learning model. Accuracy, precision, recall, F1, ROC-AUC: each answers a different question, and using the wrong one hides the problems you most need to see. This guide breaks down 18 evaluation metrics across classification, regression, and probabilistic models. For each one you get the plain-English definition, the formula, and the situations where it is the right tool, so you can judge model performance with confidence instead of guessing.
The 18 machine learning evaluation metrics at a glance
Classification metrics: Accuracy, Precision, Recall (Sensitivity), F1 Score, AUC-ROC, Confusion Matrix.
Regression metrics: Mean Absolute Error (MAE), Mean Squared Error (MSE), Root Mean Squared Error (RMSE), R-squared (R²).
Advanced and imbalanced-data metrics: Mean Bias Deviation (MBD), Cohen’s Kappa, Matthews Correlation Coefficient (MCC), Kullback-Leibler Divergence.
Probabilistic and threshold metrics: Log Loss, Precision-Recall AUC.
Cross-cutting evaluation methods: Feature Importance, Cross-Validation.
Each metric below includes its formula and the scenarios where it gives you the clearest read on model performance.
Machine learning evaluation metrics
In machine learning, success hinges on measuring, analyzing, and refining algorithmic performance. Our exploration of machine learning evaluation metrics highlights the pivotal indicators that determine your models’ effectiveness. From basic measures like accuracy and precision to advanced tools like ROC-AUC, discover what empowers businesses to assess, enhance, and optimize their machine learning algorithms.
Accuracy
Accuracy is the share of predictions your model got right, out of all predictions made. A model that correctly classifies 95 out of 100 cases has 95% accuracy. It is the simplest metric to read, which is exactly why it misleads. On imbalanced data, accuracy rewards models that ignore the rare class. If 99% of transactions are legitimate, a model that labels everything “legitimate” scores 99% and catches no fraud at all. Use accuracy as a first glance on balanced datasets, then reach for precision and recall when the classes are uneven. 
Precision
Precision answers a narrow question: of everything the model flagged as positive, how much was actually positive? A precision of 80% means 4 out of 5 positive predictions were correct. Precision matters most when a false positive is expensive. In spam filtering, high precision means real emails rarely get dumped in the spam folder. The cost of precision is that chasing it too hard makes the model cautious, so it misses real cases. That trade-off is what recall measures. 
Recall (Sensitivity)
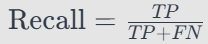
Recall flips the question: of all the actual positives that exist, how many did the model catch? A recall of 75% means the model found three-quarters of the real cases and missed the rest. Recall is the priority when missing a positive is the costly error. In cancer screening or fraud detection, you would rather investigate a few false alarms than let a real case slip through. Precision and recall pull against each other, which is why the F1 score exists to balance them. 
F1 score
The F1 score combines precision and recall into a single number using their harmonic mean. It only rises when both are healthy, so a model cannot game it by maxing one and ignoring the other. Reach for F1 when false positives and false negatives both carry real cost and you need one number to compare models. It is the default summary metric for most classification problems on imbalanced data. 
Area under the ROC curve (AUC-ROC)
AUC-ROC measures how well your model separates the positive class from the negative class across every possible decision threshold. It ranges from 0.5 (random guessing) to 1.0 (perfect separation). An AUC of 0.95 signals a model that ranks positives above negatives almost every time. The strength of AUC-ROC is that it does not depend on a single threshold, so it tells you about the model’s ranking ability overall. For the precise formulas behind each of these metrics, scikit-learn’s model evaluation documentation is the canonical reference. Be careful on heavily imbalanced data, where a high AUC-ROC can still hide poor performance on the rare class.In those cases, check Precision-Recall AUC alongside it.
Confusion matrix
The confusion matrix is not a single score but a table that lays out exactly where a model succeeds and fails: true positives, true negatives, false positives, and false negatives, all in one view. Every classification metric above is derived from these four numbers. Reading the matrix directly shows which error the model makes most, which is often what you fix first when moving machine learning models in production.
Regression model evaluation metrics
Mean absolute error (MAE)
MAE is the average size of the model’s errors, measured in the same units as what you are predicting. If you are forecasting revenue in dollars, an MAE of 500 means the model is off by $500 on average. It is easy to explain and treats every error equally, which makes it a solid default for regression. Because it does not punish large errors more than small ones, pair it with RMSE when big misses are especially costly. 
Mean squared error (MSE)
MSE averages the squares of the errors, which makes large mistakes count far more than small ones. A single big miss moves MSE much more than several small ones. That sensitivity is the point: when outliers or large errors are dangerous, MSE surfaces them. The downside is that squaring changes the units, so the raw number is hard to interpret on its own. RMSE fixes that. 
Root mean squared error (RMSE)
RMSE is the square root of MSE, which brings the error back into the original units while keeping MSE’s heavy penalty on large misses. It is the most widely reported regression metric for exactly this reason. Use RMSE when you want one interpretable number that still punishes big errors. Compare it against MAE: if RMSE is much larger than MAE, a few large errors are dominating, and that is worth investigating. 
R-squared (R²)
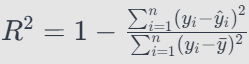
R-squared tells you what fraction of the variation in your target the model actually explains, on a scale from 0 to 1. An R² of 0.85 means the model accounts for 85% of the variability, with the rest left to noise or missing factors. It is the quickest way to communicate regression quality to a non-technical audience. Treat a high R² with caution, though: it can be inflated by adding more variables, so check adjusted R² when comparing models with different numbers of features. 
Advanced classification metrics
Mean bias deviation (MBD)
MBD measures whether your model systematically over-predicts or under-predicts. Unlike error metrics that only care about the size of mistakes, MBD keeps the direction, so positive values mean the model runs high and negative values mean it runs low. It is the metric that catches a model quietly drifting in one direction, which matters in forecasting where a consistent bias compounds over time. 
Cohen’s kappa
Cohen’s Kappa measures how well predictions agree with actual labels, after stripping out the agreement you would expect from pure chance. That correction makes it far more honest than accuracy on imbalanced data. A Kappa near 1 means strong agreement beyond luck, while a value near 0 means the model is barely better than random guessing. Use it when class distribution is skewed and you want a reality check on how good the model truly is. 
Matthews correlation coefficient (MCC)
MCC gives a single balanced score for binary classification that accounts for all four confusion-matrix categories at once. It ranges from -1 (total disagreement) through 0 (random) to +1 (perfect prediction). Many practitioners consider MCC the most reliable single metric for imbalanced binary problems, because it only produces a high score when the model performs well across positives and negatives alike. If you can track only one classification number on skewed data, MCC is a strong choice. 
Kullback-Leibler divergence (KL Divergence)
KL Divergence measures how far one probability distribution sits from another, usually how far your model’s predicted distribution is from the true distribution of the data. Lower means closer. It is the go-to metric for probabilistic models and generative tasks, where you care about matching a whole distribution rather than hitting individual labels. It is not symmetric, so the order of comparison matters. 
Log Loss
Log Loss judges not just whether a prediction was right, but how confident it was. A model that predicts the correct class with 90% confidence scores better than one that squeaks in at 51%, and a confident wrong answer is punished hard. Use Log Loss when you care about well-calibrated probabilities, not just the final label, for example in risk scoring or any system where the probability itself drives a downstream decision. Lower Log Loss is better.
Precision-Recall AUC
Precision-Recall AUC summarizes the trade-off between precision and recall across every threshold, in a single number. On heavily imbalanced data, it gives a clearer read than AUC-ROC because it focuses on performance for the rare positive class. When positives are rare and matter most, fraud, disease, defaults, trust PR-AUC over ROC-AUC.
Feature Importance
Feature importance ranks how much each input contributes to the model’s predictions. It answers “what is actually driving this model,” which is essential for debugging, for trust, and for cutting features that add noise. Beyond improving the model, importance scores make results explainable to stakeholders who need to understand why a model decided what it did, a growing requirement under data and AI governance rules.
Cross-Validation
Cross-validation tests whether your model’s performance holds up on data it has not seen, by splitting the dataset into folds, training on some and validating on the rest, then rotating. The averaged result is a far more honest estimate than a single train-test split. It is the standard defense against overfitting. A model that scores well in cross-validation is one you can actually trust to generalize, not one that memorized the training set.
Model interpretation and robustness
Feature importance
Understanding each feature’s contribution to the model’s predictions is crucial for refining and optimizing your algorithm. Feature importance metrics help identify which features drive the model’s decisions. Consequently, this guides feature engineering efforts and enhances your model’s interpretability.
Cross-validation scores
Cross-validation is an essential technique for evaluating machine learning models. It ensures the model’s generalizability to new, unseen data. This involves dividing the dataset into subsets, training the model on combinations, and validating it on the remaining data. This process helps identify overfitting issues and objectively estimates a model’s performance. For Chief People Officers concerned with model robustness, cross-validation ensures the algorithm performs well in diverse scenarios. In the competitive landscape of machine learning services, the ability to assess and refine algorithms is a strategic imperative. By leveraging these metrics, Brickclay continues to uphold its commitment to delivering cutting-edge machine-learning solutions that drive success in an ever-evolving business landscape. Evaluating machine learning algorithms remains an ongoing and dynamic process as the technological frontier advances. Therefore, staying abreast of these metrics is your key to unlocking sustained success.
How Brickclay helps you build models worth trusting
Choosing the right metric is only useful if the model behind it is built and evaluated properly. That is the work Brickclay does.
Our data science services teams build, evaluate, and deploy machine learning models with the right metric for the job, not just the one that looks good in a slide. We tune for the errors that actually cost your business, validate against unseen data to catch overfitting before it ships, and monitor models in production so accuracy does not quietly decay over time.
We have done this across churn prediction, fraud detection, forecasting, and classification problems in regulated industries, including our machine learning churn-prediction project for a subscription business.
If you are building a model and want it evaluated against the metrics that matter, or you have one in production that is drifting, let’s talk.
Related resources