


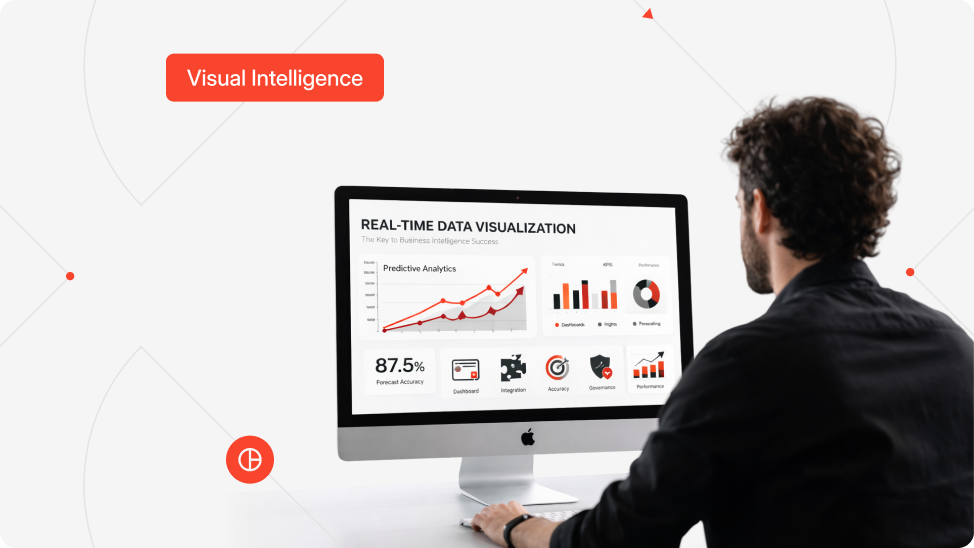
The importance of real-time data visualization in business intelligence is growing rapidly. Companies gain valuable insights into customer behavior and market trends by visualizing large datasets, which would be difficult to interpret without data visualization tools.
Data visualization involves creating graphical representations of data to simplify understanding and communication. Visual formats such as charts, graphs, maps, and plots make complex trends and patterns more accessible.
So, how can businesses make the most of data visualization? Professionals can analyze complex datasets, identify relationships, make quicker decisions, and uncover insights that static tables or text reports cannot provide.
Real-time data visualization in business intelligence
Recent research projects the global market for real-time data analysis to grow at a compound annual growth rate (CAGR) of over 13.36% from 2022 to 2027. Business intelligence helps organizations make informed decisions by collecting and analyzing data to meet operational and strategic objectives.
Companies understand that users and decision-makers need flexible options for exploring and interpreting data without specialized technical skills. Without these capabilities, BI initiatives often rely on external analysts and fail to maximize their potential.
Real-time data visualization tools provide one solution. Modern analytics platforms enable self-service BI reporting, allowing organizations to present and share information in an easily digestible and actionable format. According to Dresner Advisory Services, 62% of BI respondents rated real-time data as “critical” or “very important.”
Businesses increasingly pair data visualization with storytelling techniques to provide context and enhance the meaning of KPIs and business metrics. Organizations across sectors such as retail, healthcare, finance, and science rely on BI solutions to interpret data effectively, and data visualization remains central to this effort.
Types of data visualization
Earlier, organizations relied on text-based reports and spreadsheets supplemented with basic charts like pie charts and line graphs. Over the past decade, analytics platforms have introduced more sophisticated options to visualize complex data and support effective BI.
The type of visualization depends on the analytics tool used, but common options today include:
- Area chart: Displays trends over time, helping track performance and patterns.
- Bar chart: Simplifies complex data into bars for easy category comparisons.
- Column chart: Uses vertical columns for clear and organized insights.
- Image map: Offers interactive exploration of data for deeper insights.
- Meter chart: Gauges performance against benchmarks or goals.
- Numeric display: Highlights critical values for quick decisions.
- Pie chart: Shows proportions among categories for intuitive understanding.
- Scatter plot: Reveals correlations and outliers between variables.
- Stacked bar: Summarizes multiple variables in a single chart to highlight trends.
- Treemap: Visualizes hierarchical structures to simplify complex relationships.
Selecting the right visualization is essential to ensure end-users can understand and act on data, such as tracking retail sales across multiple regions.
Real-time data visualization business applications
Financial services
In finance, real-time data visualization helps monitor market fluctuations, trading volumes, and risk levels. Traders and investors rely on up-to-the-minute charts to respond quickly to changing conditions.
Healthcare
Medical professionals use real-time visuals to track patient vitals, detect anomalies, and act swiftly. Emergency rooms and ICUs benefit particularly, while public health agencies monitor outbreaks and respond rapidly.
Manufacturing
Manufacturers monitor production metrics such as machine uptime, output, and quality in real time. Supply chain visibility also improves as businesses track inventory, shipments, and delivery schedules.
Retail
Retailers leverage real-time data to manage inventory efficiently, minimizing stock-outs or overstocks. Sales analytics reveal trends, top-selling products, and campaign performance instantly.
Energy and utilities
Energy providers use real-time data to monitor grids, detect faults, and optimize distribution. Utilities also track resource usage like water and energy to improve efficiency and sustainability.
Transportation and logistics
Logistics companies track fleets and packages in real time to ensure timely deliveries and streamline operations. Cities use real-time traffic monitoring to reduce congestion and improve traffic flow.
Customer service
Real-time monitoring of website and app usage provides insights into customer behavior. Companies can enhance service, respond to issues quickly, and analyze social media sentiment to adapt strategies.
IoT (internet of things)
IoT devices generate vast amounts of data, and real-time visualization allows businesses to monitor connected buildings, smart devices, and factories. This ensures efficient operations and proactive maintenance.
Marketing and advertising
Marketers track campaign performance and website metrics in near real time, enabling data-driven adjustments to strategies, resource allocation, and website content optimization.
Gaming and entertainment
Real-time analytics in gaming enhances player engagement and immersion. Streaming platforms use BI to optimize content delivery based on user behavior and network conditions.
Data visualization techniques
Businesses typically use six primary visualization techniques:
- Comparison: Evaluate performance changes over time or across dimensions.
- Composition: Break down data using pie charts or bar graphs.
- Distribution: Illustrate how values are spread over time or categories.
- KPI: Highlight the current state of key metrics.
- Relationships: Show connections between metrics using scatter plots.
- Location: Map data spatially on layouts or geographic maps.
Effective visualization requires careful planning, considering both the audience and the key insights to convey. Proper planning ensures shared understanding and actionable insights.
Value of data visualization in business intelligence
Visual input represents 90% of information received by the brain, and by 2025, global data creation is expected to reach 180 zettabytes. Without proper visualization methods, large datasets can overwhelm users.
Enterprises increasingly invest in data visualization skills to interpret complex information efficiently. Tableau highlighted a case study showing how real-time visualization improved risk management and decision-making, resulting in significant cost savings and better insights.
Since humans process visuals efficiently, BI tools that include dynamic visualizations enable users to grasp insights quickly and support data-driven decision-making.
Data visualization for business intelligence success
Data visualization not only makes insights more engaging but also strengthens strategic decision-making. Key benefits include:
- Think about the big picture: Explore interaction, transaction, and behavioral data to uncover patterns and assess overall performance.
- Identify significance: Discover insights that guide resource allocation and highlight opportunities for improvement.
- Make smart choices: Leverage data-driven insights to make informed decisions rather than relying on intuition.
- Track trends: Monitor evolving data trends to spot issues and opportunities, guiding more effective strategies.
BI reporting and data visualization best practices
Define audience
Tailor visualizations to the audience to ensure relevance and encourage action.
Context matters
Combine compelling graphics with narrative to motivate users to act on the data.
Format and sort
Organize information logically and simplify visuals using charts, labels, icons, and lines.
Correctly display values
Choose visual formats that accurately represent data relationships, such as using bars instead of lines when appropriate.
How can Brickclay help?
Comprehensive services
Brickclay offers data visualization services to help organizations succeed in a data-driven world. We design data architectures, ensure data quality, and enable ad-hoc querying and predictive analytics.
Strategic guidance
Our experts assist companies in developing tailored BI strategies, implementing data warehousing solutions, and transforming insights into actionable decisions for long-term success.
Contact us to learn more about how Brickclay supports businesses in harnessing the power of data visualization.